
Page 38 - Year in Review 2018/2019
P. 38
NAFA Graduates
THE FUTURE AND BEYOND
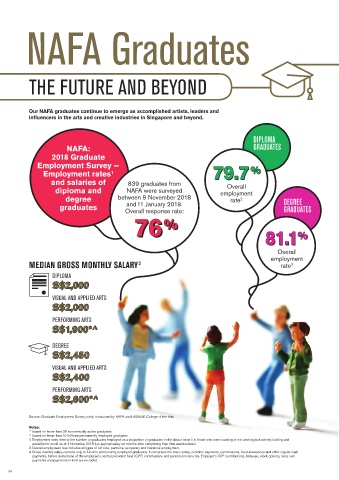
Our NAFA graduates continue to emerge as accomplished artists, leaders and
influencers in the arts and creative industries in Singapore and beyond.
DIPLOMA
NAFA: GRADUATES
2018 Graduate
Employment Survey —
79.7
%
Employment rates 79.7 %
1
and salaries of 839 graduates from
Overall
diploma and NAFA were surveyed employment
degree between 9 November 2018 rate 2 DEGREE
graduates and 11 January 2019. GRADUATES
Overall response rate:
76 % 81.1 %
76
%
81.1
%
Overall
employment
MEDIAN GROSS MONTHLY SALARY 3 rate 2
DIPLOMA
S$2,000
S$2,000
VISUAL AND APPLIED ARTS
S$2,000
S$2,000
PERFORMING ARTS
S$1,900*^
S$1,900*^
DEGREE
S$2,450
S$2,450
VISUAL AND APPLIED ARTS
S$2,400
S$2,400
PERFORMING ARTS
S$2,600*^
S$2,600*^
Source: Graduate Employment Survey jointly conducted by NAFA and LASALLE College of the Arts
Notes:
* based on fewer than 30 economically active graduates
^ based on fewer than 10 full-time permanently employed graduates
1. Employment rates refer to the number of graduates employed as a proportion of graduates in the labour force (i.e. those who were working or not working but actively looking and
available for work) as at 1 November 2018 (i.e. approximately six months after completing their final examinations).
2. Overall employment rate includes all types of full-time, part-time, temporary and freelance employment.
3. Gross monthly salary pertains only to full-time permanently employed graduates. It comprises the basic salary, overtime payments, commissions, fixed allowances and other regular cash
payments, before deductions of the employee’s central provident fund (CPF) contributions and personal income tax. Employer’s CPF contributions, bonuses, stock options, lump sum
payments and payments-in-kind are excluded.
38